

Next: Kinetic bottlenecks
Up: Modified Potential Energy Surfaces
Previous: Barrier heights
Home: Return to my homepage
In the energy landscape model of protein folding, the slope of the funnel (potential energy gradient)
is a key parameter[246,250].
Here we analyse the effect of the slope by varying  .
To keep Ef constant we must also vary E2.
For the case when
  is zero, i.e. a flat surface, El=10 for
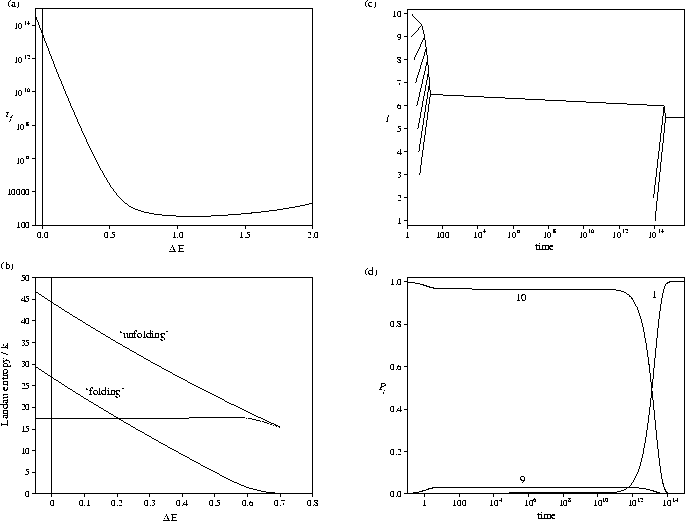
  .It can be seen from Figure 5.7a that the slope has a dramatic effect on the folding time,
and that a sufficiently steep slope is necessary for reasonably rapid
relaxation to the global minimum.
This behaviour can be explained from the relative rates of uphill and downhill transitions
in our model.
The barrier for going downhill is b, and for going uphill
  .Therefore, the downhill transition rate is not significantly affected by the slope,
but the uphill rate decreases rapidly as the slope is increased. For the flat PES taking a step to higher
l is, ignoring the vibrational contributions to the rate, g times more likely than to lower l,
causing the probability distribution to remain concentrated
at large values of l. As a slope is introduced into the PES
the uphill rate decreases relative to the downhill rate and the folding time begins to decrease rapidly.
However, once the PES is sufficiently steep to make the uphill rate small compared to the downhill rate,
further increasing the slope only has a limited effect. At large
  the folding time even begins
to increase again because the level l=2 begins to have a low enough energy for it to have a significant
equilibrium population.
Figure 5.7:
(a) Variation of tf with the slope of the PES.
(b) Variation of the magnitude of the Landau entropy bottlenecks (solid lines) with  .The dashed line gives the magnitude of the Landau entropy difference between the two stable states.
(c) Equilibration tree and (d) time evolution of the probabilities, Pl,
for the flat PES (
 =0) from an initial distribution P10=1.
All results are for E=26.41.
 |
An equivalent explanation for the behaviour can be provided in terms of the Landau entropy.
In order to keep Ef constant as the slope is decreased
the energy of the intermediate levels must be increased.
This has the effect of reducing the equilibrium probability for
occupation of these levels. Therefore, as  is decreased a Landau entropy bottleneck develops
and then increases in depth (Figure 5.7b). The folding time increases
rapidly as the bottleneck deepens, but has only a weak dependence on
  when there is a single
Landau entropy maximum.
The flat PES would correspond to the Levinthal limit where the states are searched randomly,
but for the variation of the vibrational frequency with l, which makes the minima in higher levels slightly
more probable.
For this PES, equilibration occurs initially at large values of l
and proceeds away from the Landau entropy maximum.
There is a large separation (of the order of 1013) between the time scales for equilibration
within the large l entropy maximum and between the entropy maxima (Figure 5.7c),
because of the deep Landau entropy bottleneck. This is evidenced by the probability flows
across the PES (Figure 5.7d); P10 and P9 rapidly reach local equilibrium values, which then
decay away as the ground state is slowly populated.
These results help to explain why potassium chloride clusters are able to relax
to the rock-salt structures so rapidly[91].
Reaction pathways leading down to the rock-salt structures generally exhibit[252]
 .
.
As  is decreased E2, which is simply the energy gap between the
global minimum and the next lowest energy state, has to be increased to maintain Ef.
Therefore, the efficiency with which the global minimum is found
is reduced as E2 is increased.
This result does not necessarily contradict the view of Sali , however, since
we can decouple factors in our model in a way that may not be possible for real PES's.
However, it does show that even if the energy gap view were correct, it would require further explanation;
it is not self-evident why an energy gap should guarantee kinetic foldability.
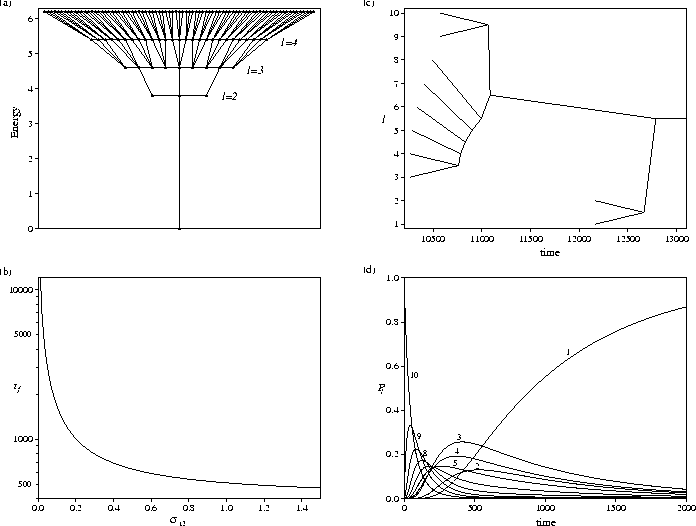
Figure 5.8:
(a) Schematic depiction of a PES with a kinetic bottleneck. g=3,
and  except for
  .(b) Dependence of tf on
  .(c) Equilibration tree and (d) time evolution of the probabilities, Pl,
from an initial distribution P10=1 for a PES with
  .
All results are for E=26.41.
 |


Next: Kinetic bottlenecks
Up: Modified Potential Energy Surfaces
Previous: Barrier heights
Jon Doye
8/27/1997


![]() is decreased a Landau entropy bottleneck develops
and then increases in depth (Figure 5.7b). The folding time increases
rapidly as the bottleneck deepens, but has only a weak dependence on
is decreased a Landau entropy bottleneck develops
and then increases in depth (Figure 5.7b). The folding time increases
rapidly as the bottleneck deepens, but has only a weak dependence on ![]() when there is a single
Landau entropy maximum.
when there is a single
Landau entropy maximum.
![]() .
.![]() is decreased E2, which is simply the energy gap between the
global minimum and the next lowest energy state, has to be increased to maintain Ef.
Therefore, the efficiency with which the global minimum is found
is reduced as E2 is increased.
This result does not necessarily contradict the view of Sali , however, since
we can decouple factors in our model in a way that may not be possible for real PES's.
However, it does show that even if the energy gap view were correct, it would require further explanation;
it is not self-evident why an energy gap should guarantee kinetic foldability.
is decreased E2, which is simply the energy gap between the
global minimum and the next lowest energy state, has to be increased to maintain Ef.
Therefore, the efficiency with which the global minimum is found
is reduced as E2 is increased.
This result does not necessarily contradict the view of Sali , however, since
we can decouple factors in our model in a way that may not be possible for real PES's.
However, it does show that even if the energy gap view were correct, it would require further explanation;
it is not self-evident why an energy gap should guarantee kinetic foldability.
