

Next: Electronic vs Geometric Magic
Up: The Structure and Stability
Previous: Liquid Structure
Home: Return to my homepage
In this section we shall illustrate the effects of the range of the potential on cluster thermodynamics
in more detail, by presenting results of simulations of M55 at different values of the
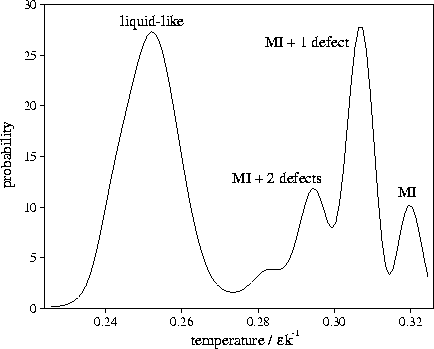
range parameter,  .As in §3.3 we use STA temperature distributions (e.g. Figure 4.13) to decompose the caloric curve
into contributions from different states.
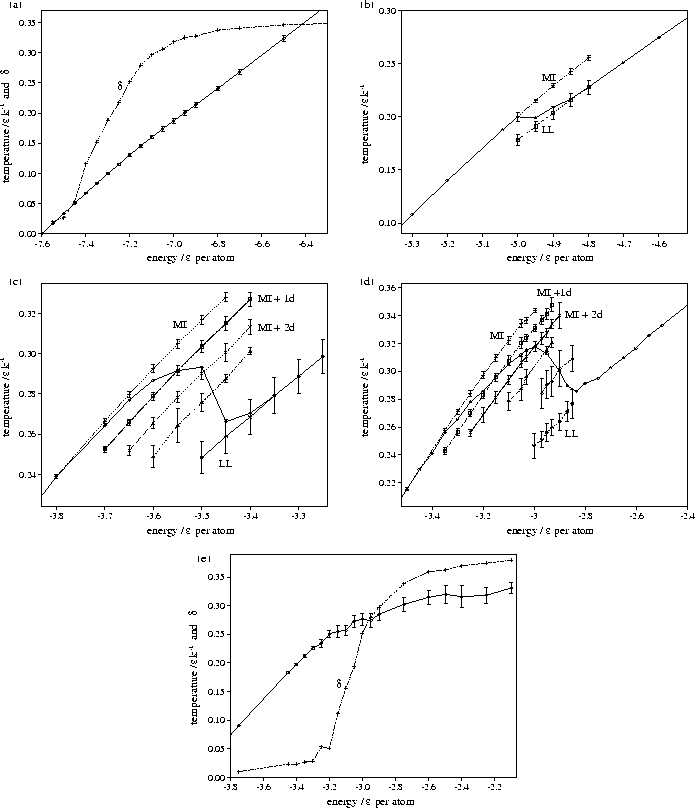
The caloric curves for M55 at five different values of
  are shown in Figure 4.14.
At
  =6, the melting behaviour is very similar to that seen for M55
in §3.3.
The caloric curve has a Van der Waals loop,
and surface defects of the Mackay icosahedron can be generated
at energies just below that required for complete melting.
In comparison, the
  =9 caloric curve shows a higher melting
temperature, a deeper S-bend and a greater role for the defective states.
This is a direct result of the increasing energy gap between the Mackay icosahedron and
the `liquid-like' band of minima noted in §4.3.
At
  =4, the melting temperature is lower than for
  =6, the latent heat is smaller and
defective Mackay icosahedra are not seen.
Again this can be related to the correlation diagram Figure 4.4 and
is simply a result of the decrease in the energy gap between the Mackay icosahedron and
the `liquid-like' band of minima as
  is decreased.
Figure 4.13:
An example of a multimodal short time-averaged temperature distribution. It is from
an MD run for M55 at  at an energy of
  .Each temperature peak is labelled with the structure associated with it.
MI stands for Mackay icosahedron. The averaging period is 3000 time steps.
 |
Figure 4.14:
Caloric curves for M55 for  (a) 3, (b) 4, (c) 6, (d) 9 and (e) 13. For
 =3 and 13 Lindemann's
  has also been plotted, so that the
melting region can be identified. For
  =4, 6 and 9 the solid line without error bars is the
overall caloric curve, and the dashed lines with error bars are the average values of the temperature
for the peaks in the STA temperature distribution. The latter lines are labelled with the structures associated
with them. MI stands for Mackay icosahedron, + nd for a structure with n defects, and LL for liquid-like.
 |
The behaviour at  =3 and 13 is significantly different; in particular the
melting transitions are closer to a continuous transition than a two-state transition,
i.e. between a liquid and a solid.
At
  , the lowest energy minimum that we have found is 55A.
This minimum lies at the bottom of the band of `liquid-like' minima, which is approximately continuous in energy.
At low temperatures transitions from 55A to higher energy minima begin to occur, because of the small
differences in energy. This leads to the fluxional liquid-like behaviour which
is exhibited in the rise in Lindemann's
  (Figure 4.14a).
Melting occurs at low temperatures without producing any noticeable feature in the
caloric curve--the latent heat is essentially zero.
For  =13, on the other hand, the global minimum is the decahedral structure 55C.
The difference in energy between this structure and the `liquid-like' band of minima is now so
large that a transition to the latter is only observed at the highest energies (
 )probed by our simulation.
This transition occurs after
  has risen to a value which indicates that the
cluster has already melted, and does not lead to a noticeable feature in the caloric curve.
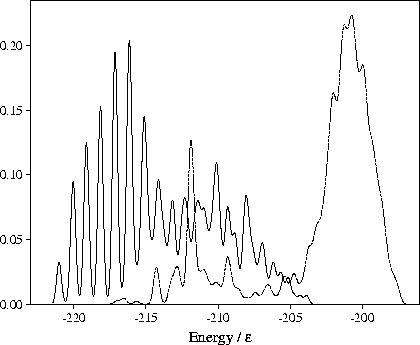
Instead, as energy is added to 55C, the cluster progresses up a ladder of increasingly defective
structures (Figure 4.15--the minima bunch into bands that have the same number of
nearest neighbours). This climbing up the PES leads to the decreased slope of the
caloric curve at higher energies. The melting transition is quasicontinuous and mediated by defect motion.
Defective states of 55C are observed at a lower temperature than the defective states of the Mackay icosahedron
in the simulations at
  =6 and 9 simply because the energy gap between the icosahedron and its defective
states is larger; the first defective state of the icosahedron has three fewer nearest-neighbour contacts
whereas the first defective state of 55C has one less contact[71].
Figure 4.15:
Probability distributions of the potential energy for samples of minima for M55 at  =13.
The solid line is for a sample of 357 minima obtained by quenching from simulations performed for
  13
at energies below
  .
The dashed line is for the
  6 sample of minima after reoptimization at
  13.
13.
 |
The dependence of the thermodynamic behaviour of M55 on its energetic
distribution of minima agrees very well with that predicted in a seminal paper
by Bixon and Jortner[152], which elucidated this relationship for model PES's.
In particular, these authors predicted that significant features in the caloric curve, such as an S-bend,
would only be seen when there is a large energy gap between the solid and liquid states (e.g.  =4, 6 and 9),
and not when the energetic distribution of minima is quasi-continuous (e.g.
  =3 and 13).


Next: Electronic vs Geometric Magic
Up: The Structure and Stability
Previous: Liquid Structure
Home: Return to my homepage
Jon Doye
8/27/1997


![]() =3 and 13 is significantly different; in particular the
melting transitions are closer to a continuous transition than a two-state transition,
i.e. between a liquid and a solid.
At
=3 and 13 is significantly different; in particular the
melting transitions are closer to a continuous transition than a two-state transition,
i.e. between a liquid and a solid.
At ![]() , the lowest energy minimum that we have found is 55A.
This minimum lies at the bottom of the band of `liquid-like' minima, which is approximately continuous in energy.
At low temperatures transitions from 55A to higher energy minima begin to occur, because of the small
differences in energy. This leads to the fluxional liquid-like behaviour which
is exhibited in the rise in Lindemann's
, the lowest energy minimum that we have found is 55A.
This minimum lies at the bottom of the band of `liquid-like' minima, which is approximately continuous in energy.
At low temperatures transitions from 55A to higher energy minima begin to occur, because of the small
differences in energy. This leads to the fluxional liquid-like behaviour which
is exhibited in the rise in Lindemann's ![]() (Figure 4.14a).
Melting occurs at low temperatures without producing any noticeable feature in the
caloric curve--the latent heat is essentially zero.
(Figure 4.14a).
Melting occurs at low temperatures without producing any noticeable feature in the
caloric curve--the latent heat is essentially zero.
![]() =13, on the other hand, the global minimum is the decahedral structure 55C.
The difference in energy between this structure and the `liquid-like' band of minima is now so
large that a transition to the latter is only observed at the highest energies (
=13, on the other hand, the global minimum is the decahedral structure 55C.
The difference in energy between this structure and the `liquid-like' band of minima is now so
large that a transition to the latter is only observed at the highest energies (![]() )probed by our simulation.
This transition occurs after
)probed by our simulation.
This transition occurs after ![]() has risen to a value which indicates that the
cluster has already melted, and does not lead to a noticeable feature in the caloric curve.
Instead, as energy is added to 55C, the cluster progresses up a ladder of increasingly defective
structures (Figure 4.15--the minima bunch into bands that have the same number of
nearest neighbours). This climbing up the PES leads to the decreased slope of the
caloric curve at higher energies. The melting transition is quasicontinuous and mediated by defect motion.
Defective states of 55C are observed at a lower temperature than the defective states of the Mackay icosahedron
in the simulations at
has risen to a value which indicates that the
cluster has already melted, and does not lead to a noticeable feature in the caloric curve.
Instead, as energy is added to 55C, the cluster progresses up a ladder of increasingly defective
structures (Figure 4.15--the minima bunch into bands that have the same number of
nearest neighbours). This climbing up the PES leads to the decreased slope of the
caloric curve at higher energies. The melting transition is quasicontinuous and mediated by defect motion.
Defective states of 55C are observed at a lower temperature than the defective states of the Mackay icosahedron
in the simulations at ![]() =6 and 9 simply because the energy gap between the icosahedron and its defective
states is larger; the first defective state of the icosahedron has three fewer nearest-neighbour contacts
whereas the first defective state of 55C has one less contact[71].
=6 and 9 simply because the energy gap between the icosahedron and its defective
states is larger; the first defective state of the icosahedron has three fewer nearest-neighbour contacts
whereas the first defective state of 55C has one less contact[71].

![]() =4, 6 and 9),
and not when the energetic distribution of minima is quasi-continuous (e.g.
=4, 6 and 9),
and not when the energetic distribution of minima is quasi-continuous (e.g. ![]() =3 and 13).
=3 and 13).