|
Research
|
Energy Landscapes
Like many other systems if the force laws describing the interactions between the atoms of the cluster are known, the potential energy can be calculated as a function of the position of all the atoms, thus defining the potential energy surface. The potential energy surface has topographical features similar to the landscape of the earth's surface, such as mountains, valleys and hollows - albeit in a much higher dimension - and so it is often called an energy landscape. The energy landscape is particularly important because it determines the behaviour of a system. I have used clusters as an example system to understand the nature of this relationship between landscape and behaviour.The multi-dimensionality of the energy landscape makes it hard to visualize what the energy landscape `looks like'. Disconnectivity graphs are a useful way of overcoming this problem. They provide a picture of the magnitudes of the barriers between minima and enable large scale topographical features, such as funnels, to be visualized. A collection of disconnectivity graphs can be found here.
The thermodynamic properties of a system are given by the partition function. As this can be rewritten as a sum over all the minima of the partition functions of each individual minimum, we are able to compute the thermodynamic properties of a system from a representative sample of minima. This enables the thermodynamic contributions of different regions of the energy landscape to be examined, thus providing physical insight.
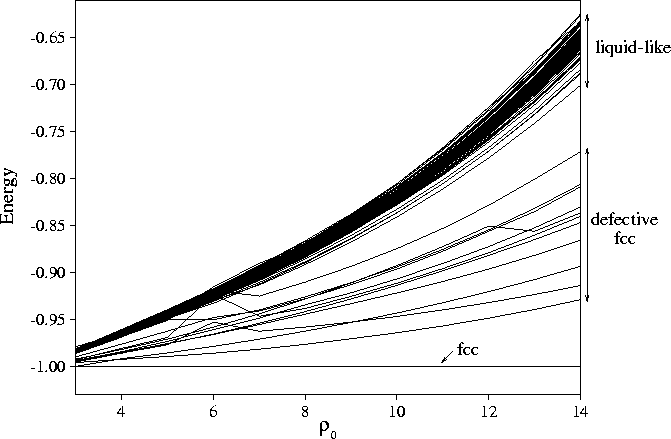
For example, the energy landscape picture of melting is of a transition from the global minimum (and perhaps other low energy minima based upon it) to the huge number of high energy minima associated with the liquid because of their greater entropy. One of the determinants of the melting point is the energy gap between the global minimum and the `liquid-like' minima; if this gap increases the liquid phase is destabilized. Much interest in the effect of the interaction range on the phase diagram has been generated by the discovery that a liquid of C60 molecules is only marginally stable. This unusual behaviour was attributed to the short range of the interactions between these molecules (relative to their size). I was able to provide a structural explanation for this behaviour by following the energetics of a set of minima as function of a parameter, rho, which determines the range of the interactions. The energy gap between the solid and the liquid-like minima increase as the range of the potential is decreased (see picture below). The potential well becomes increasingly narrow as the range decreases giving rise to an increasing energetic penalty for the dispersion of nearest-neighbour distances associated with the disordered liquid-like minima.

Associated Publications
Disconnectivity Graphs
- J.P.K. Doye, M.A. Miller and D.J. Wales, J. Chem. Phys. 111, 8417-8428 (1999)
Evolution of the Potential Energy Surface with Size for Lennard-Jones Clusters
Thermodynamics
-
J.P.K. Doye and D.J. Wales, J. Phys. B 29, 4859-4894 (1996)
The effect of the range of the potential on the structure and stability of simple liquids: from clusters to bulk, from sodium to C60 - J.P.K. Doye and D.J. Wales, Science 271, 484-487 (1996)
The structure and stability of atomic liquids: from clusters to bulk - D.J. Wales and J.P.K. Doye, J. Chem. Phys. 103, 3061-3070 (1995)
Coexistence and phase separation in clusters: From the small to the not-so-small regime - J.P.K. Doye and D.J. Wales, J. Chem. Phys. 102, 9673-9688, (1995)
An order parameter approach to coexistence in atomic clusters - J.P.K. Doye and D.J. Wales, J. Chem. Phys. 102, 9659-9672 (1995)
Calculation of thermodynamic properties of small Lennard-Jones clusters incorporating anharmonicity
Dynamics
- J.P.K. Doye and D.J. Wales, J. Chem. Phys. 111, 11070-11079 (1999)
The dynamics of structural transitions in sodium chloride clusters - M.A. Miller, J.P.K. Doye and D.J. Wales, Phys. Rev. E 60, 3701-3718 (1999)
Structural relaxation in atomic clusters: Master equation dynamics - J.P.K. Doye and D.J. Wales, J. Chem. Phys. 105, 8428-8445 (1996)
On potential energy surfaces and relaxation to the global minimum
Home Publications Research Links Cambridge Cluster Database