
(5.9)
(5.10)
(5.11)
(5.12)
 |
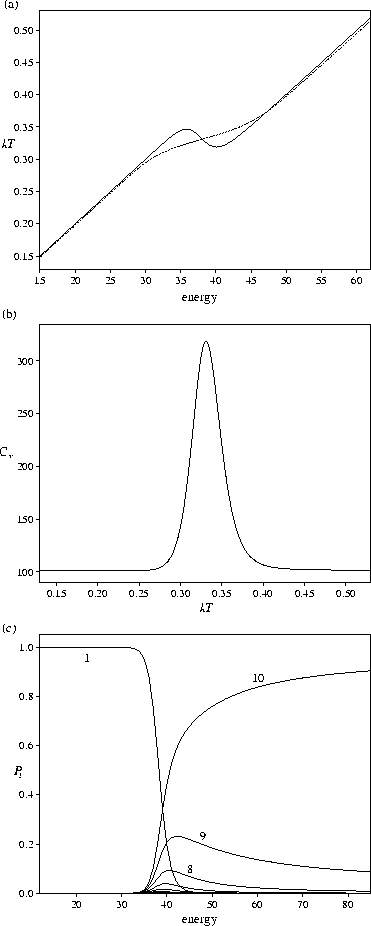
It can be seen from Figure 5.2 that the system shows the finite-size analogue of a first-order phase transition; there are prominent features in the caloric curves and a large peak in the heat capacity. The transition has a two-state character involving the global minimum and minima in the highest energy region of the PES, with intermediate minima never being significantly populated at equilibrium (Figure 5.2c). The energy at which the global minimum has an equilibrium probability of 0.5, Ef, can be used as a definition of the transition energy. For our standard' PES, Ef=38.2745.
Also of note is the Van der Waals loop that occurs in the
microcanonical caloric curve (Figure 5.2a), which is a feature unique to finite systems[134].
Such loops have been commonly observed for clusters[135,136]
and have also been noted in protein simulations[258].
In small clusters the physical cause of this region of
negative heat capacity is the absence of phase separation,
which is prevented by the relatively high energetic cost of an interface
between the solid-like and liquid-like regions[176].
 |
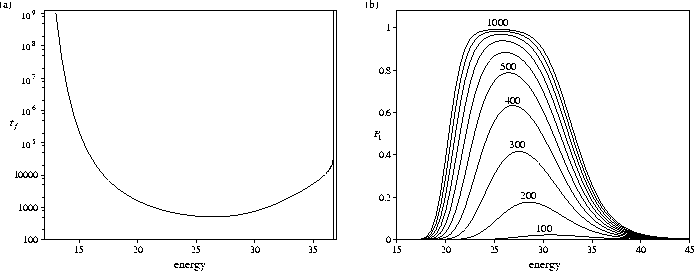
The microcanonical dynamics of the system were examined by initially populating the highest energy state, i.e. setting P10(0)=1, and observing the relaxation towards equilibrium at constant energy. The corresponding canonical results are omitted for brevity. We consider in particular the time required for the global minimum to develop an 80% probability of occupation. By analogy to relaxation in proteins we call this the `folding' time, tf; i.e. P1(tf)=0.8. The dependence of tf on E for the standard PES is shown in Figure 5.3a. There is a clear minimum in tf which occurs at an energy, Emax, of 26.41 (=0.69Ef). The folding time increases rapidly at low energy because it becomes more difficult to overcome the barriers on the PES, and increases at higher energies because the thermodynamic driving force towards the global minimum is diminished. Similar maxima have been seen in the folding rates of model proteins[247,259,260,261,262] in the `crystallization' rate of a (KCl)32 cluster[91], and in the nucleation rate of glasses[263]; these maxima occur for the same reasons as for our model PES. Maxima in the folding rates have also been observed in experiments on proteins which are rapid folders[264,265,266], but the interpretation of these results is complicated by the fact that real proteins can undergo low temperature denaturation[267].
Another view of the relaxation dynamics is provided by Figure 5.3b which shows the increase in the population of the ground state with time; there is again an energy window for which the global minimum can become significantly populated. It is interesting to note that the energy at which the maximum in the population of the global minimum occurs decreases somewhat as the time increases. This indicates that to optimize the population of the global minimum one should not quench the system to a low energy and let it evolve, but rather use a cooling schedule whereby the energy is decreased as a function of time, as in constant thermodynamic speed annealing[268].
To further understand the dynamics of the system it is helpful to use Landau functions.
In the microcanonical ensemble the presence of a first-order phase transition is indicated by
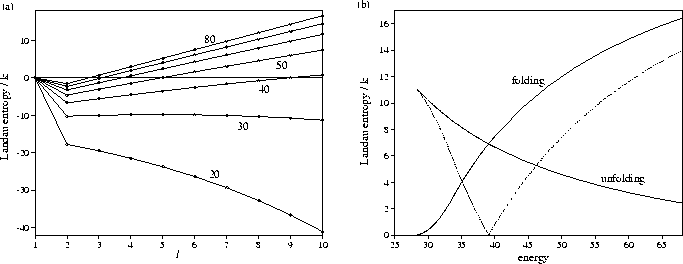
two maxima in the Landau entropy separated by a well.
We choose to call the minimum in the Landau entropy an entropy bottleneck,
since it represents a constricted region of phase space which has a lower density of states
than the regions that it connects.
The Landau profiles also enable us to understand the influence of the thermodynamics on
the dynamics. If there is one stable state, relaxation to that state is likely
to be rapid unless other kinetic factors intervene.
If there are two stable states, the rate of transition
from the metastable to the stable state decreases as the entropy bottleneck becomes narrower
or the free energy barrier increases.
The importance of the Landau free energy in understanding protein folding has been
recognized by Bryngelson , who considered the dynamics expected for a number of
different Landau free energy profiles[245].
 |
Application of a Landau-type analysis using a restricted thermodynamic
potential depends on finding a suitable order parameter
which can differentiate between the states of interest.
For many systems this can be a difficult task,
but for our model PES l provides a natural order parameter since it is
a measure of the distance from the global minimum.
The Landau entropy is then defined as ![]() and
the Landau free energy by
and
the Landau free energy by ![]() .
Landau entropy profiles for our standard PES are
given in Figure 5.4 for a range of energies. At low energy there is a single maximum
corresponding to the global minimum, and relaxation to the global minimum is
thermodynamically `downhill'.
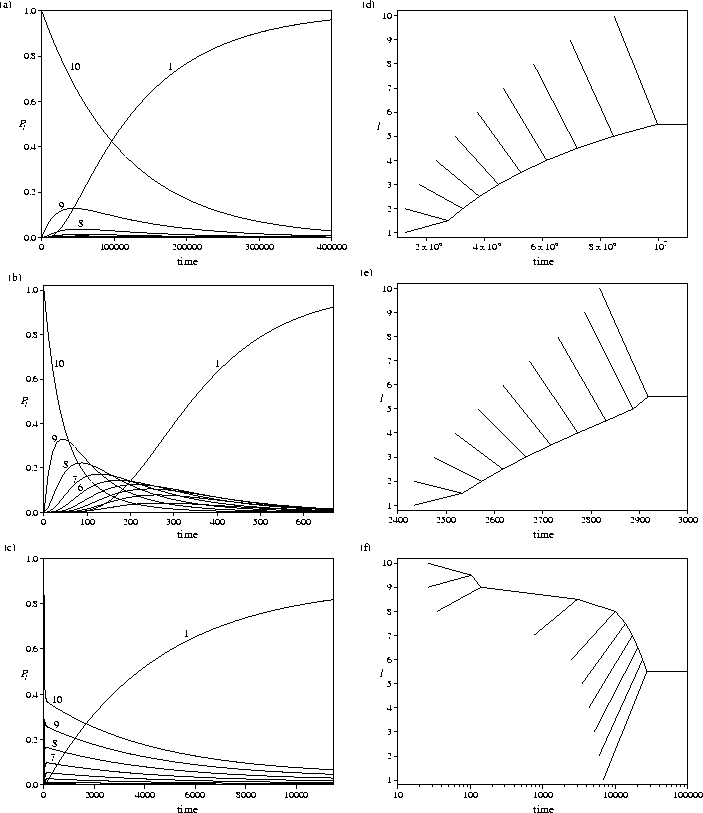
Consequently at Emax, the probability density `flows' smoothly down the PES
with the intermediate states having significant transient populations (Figure 5.5).
.
Landau entropy profiles for our standard PES are
given in Figure 5.4 for a range of energies. At low energy there is a single maximum
corresponding to the global minimum, and relaxation to the global minimum is
thermodynamically `downhill'.
Consequently at Emax, the probability density `flows' smoothly down the PES
with the intermediate states having significant transient populations (Figure 5.5).
The equilibration trees in Figure 5.5 map out the times at which different levels come
in to approximate equilibrium with each other (as defined by equation 5.3).
At Emax levels 1 and 2 first reach local equilibrium (Figure 5.5e),
i.e. equilibrium first occurs between the levels corresponding to the Landau entropy maximum.
Next, level 3 reaches equilibrium with levels 1 and 2, and so on to higher values of l:
the local equilibrium propagates to higher energy away from the Landau entropy maximum.
Similar behaviour occurs at lower energies, except that the barriers
on the PES have a larger retarding effect on the dynamics.
Therefore, the equilibration tree at E=15 (Figure 5.5c) shows the same
structure as at Emax except that the time scales are around a thousand times slower.
In the microcanonical ensemble the kinetic energy increases as the potential energy decreases.
Consequently, at low energies the transition rate over the barriers is much slower at the
top of the PES, and the system accelerates as it descends the PES. Therefore,
transient populations in the intermediate states are less pronounced at E=15 than at Emax.
In the canonical ensemble this effect is absent because the kinetic energy is
independent of the position in configuration space.
 |
For E>28.238, there are two Landau entropy maxima, which correspond to the global minimum and the high potential energy `unfolded' states. The entropy bottleneck occurs because at lower potential energy the loss in entropy due to the reduced number of minima is not completely compensated by the greater vibrational entropy that results from the larger kinetic energy. As a result of the entropy bottleneck, the equilibration trees have a qualitatively different form from those at lower energies; equilibration initially occurs within the secondary Landau entropy maximum corresponding to the higher lying levels and then propagates down the PES (Figure 5.5f). It is interesting to note that this change in direction of equilibration appears at approximately the same energy as the Landau entropy bottleneck. For E=36 there is a separation of time scales between equilibration within the secondary Landau entropy maximum, and equilibration between the maxima. This is reflected in the time evolution of the probability distribution: the probabilities of occupying higher potential energy levels rapidly attain approximate local equilibrium values which then slowly decay as the global minimum becomes more populated (Figure 5.5c).
Similar behaviour is seen for the Landau free energy in the canonical ensemble.
In fact, the temperature at which AL develops a double well can be derived
analytically (assuming that ![]() is small).
Two free energy minima are observed if
is small).
Two free energy minima are observed if
 |
(5.13) |
Landau free energy profiles have previously been calculated for lattice models of proteins[233,234,247,250,258]. They show a similar behaviour to that found for our model PES, with a single minimum at low temperature, and two stable states at higher temperatures corresponding to the folded and unfolded protein[233,234,247]. For clusters there can be a range of temperature around the melting transition for which Landau functions reveal two stable states corresponding to the solid-like and liquid-like states[112,133]. Similarly it has been shown that the nucleation of a crystalline phase from the bulk Lennard-Jones liquid involves a large free energy barrier[269,270].